Part of the ShopifyLift Series
Start here: The Shopify Growth Guide 2026: Key Strategies and Trends Every Merchant Should Know
Related deep dives:
Shopify Core Web Vitals and Site Speed: The Complete 2026 Guide to Performance Optimization
Google's Core Web Vitals are no longer optional for Shopify stores. In 2024-2026, site speed became a direct ranking factor and more importantly, a conversion lever.
Here's what we know:
Every 100ms of load time delay = 1% conversion loss (Amazon's finding still holds). For a 1,000-visitor/day store with 2% conversion rate, a 500ms slowdown costs $36,500 per year in lost revenue.
But this isn't just about rankings or revenue. Core Web Vitals measure real user experience:
- LCP (Largest Contentful Paint): How fast does your store feel?
- INP (Interaction to Next Paint): How responsive is it when visitors interact?
- CLS (Cumulative Layout Shift): Does the page jiggle as it loads? (Terrible UX)
Most Shopify stores fail all three metrics. The average Shopify store:
- LCP: 4.2 seconds (target: <2.5 seconds)
- INP: 280ms (target: <200ms)
- CLS: 0.18 (target: <0.1)
This guide walks through what each metric means, why it matters, how to measure it, and a 30-day implementation playbook to fix every one of them without hiring expensive developers.
Why Site Speed Matters (The Business Case)
Site speed impacts three bottom-line metrics:
1. Conversion Rate (Direct Impact)
Studies across e-commerce confirm: every 100ms delay = -1% conversion.
| Page Load Time | Conversion Rate | Revenue Impact |
|---|---|---|
| <1 second | 5.0% | Baseline |
| 2 seconds | 4.95% | -1% |
| 3 seconds | 4.90% | -2% |
| 5 seconds | 4.75% | -5% |
| 10 seconds | 4.45% | -11% |
For a store generating $100K/month:
- Current load time: 4 seconds → 2% conversion rate = $100K revenue
- Optimized to 2 seconds → 2.04% conversion rate = $102K revenue
- +$24K annual revenue for the same traffic
2. SEO Rankings (Indirect Impact)
Google explicitly ranks fast sites higher. Core Web Vitals became a ranking factor in 2021, equal in importance to SSL security and mobile responsiveness. Studies show:
- A site with identical content but 40% slower load time ranks 1-3 positions lower on average
- Improving from "Needs Improvement" to "Good" Core Web Vitals moves average rank up +2-3 positions
- For high-competition keywords, this 2-3 position move is the difference between $0-$50K/month organic revenue
Real example: A store ranking #5 for "women's running shoes" (competitive keyword) gets ~200 organic clicks/month. Moving to #2 = 1,200 organic clicks/month (+500%). At 2% conversion = +20 sales/month.
Impact: Losing position 3→5 on Google typically means -30-40% organic traffic drop. ~$15-30K monthly revenue loss.
Why Core Web Vitals Matter for Rankings:
Google has explicitly stated Core Web Vitals impact ranking as much as SSL security (which was a tiebreaker for 10+ years). The math: a page that loads fast but feels slow (poor INP) is actually worse UX than a page that loads moderately fast but responds instantly.
In 2024, Google began rewarding sites with excellent INP over LCP a shift recognizing that interactivity matters more than initial load time. Optimization strategy: don't optimize LCP at the expense of INP.
3. User Experience (Indirect Impact)
Slow sites feel broken. Visitors bounce. Even if they don't leave immediately, they form a negative impression of your brand:
- 53% of users abandon pages that take >3 seconds to load
- 40% of users leave if page takes >5 seconds
- Mobile users are even more impatient
The good news: most Shopify performance issues are fixable in 2-4 weeks with no coding required.
Core Web Vitals Explained: LCP, INP, and CLS
Google measures three specific metrics. Each has a "good" threshold:
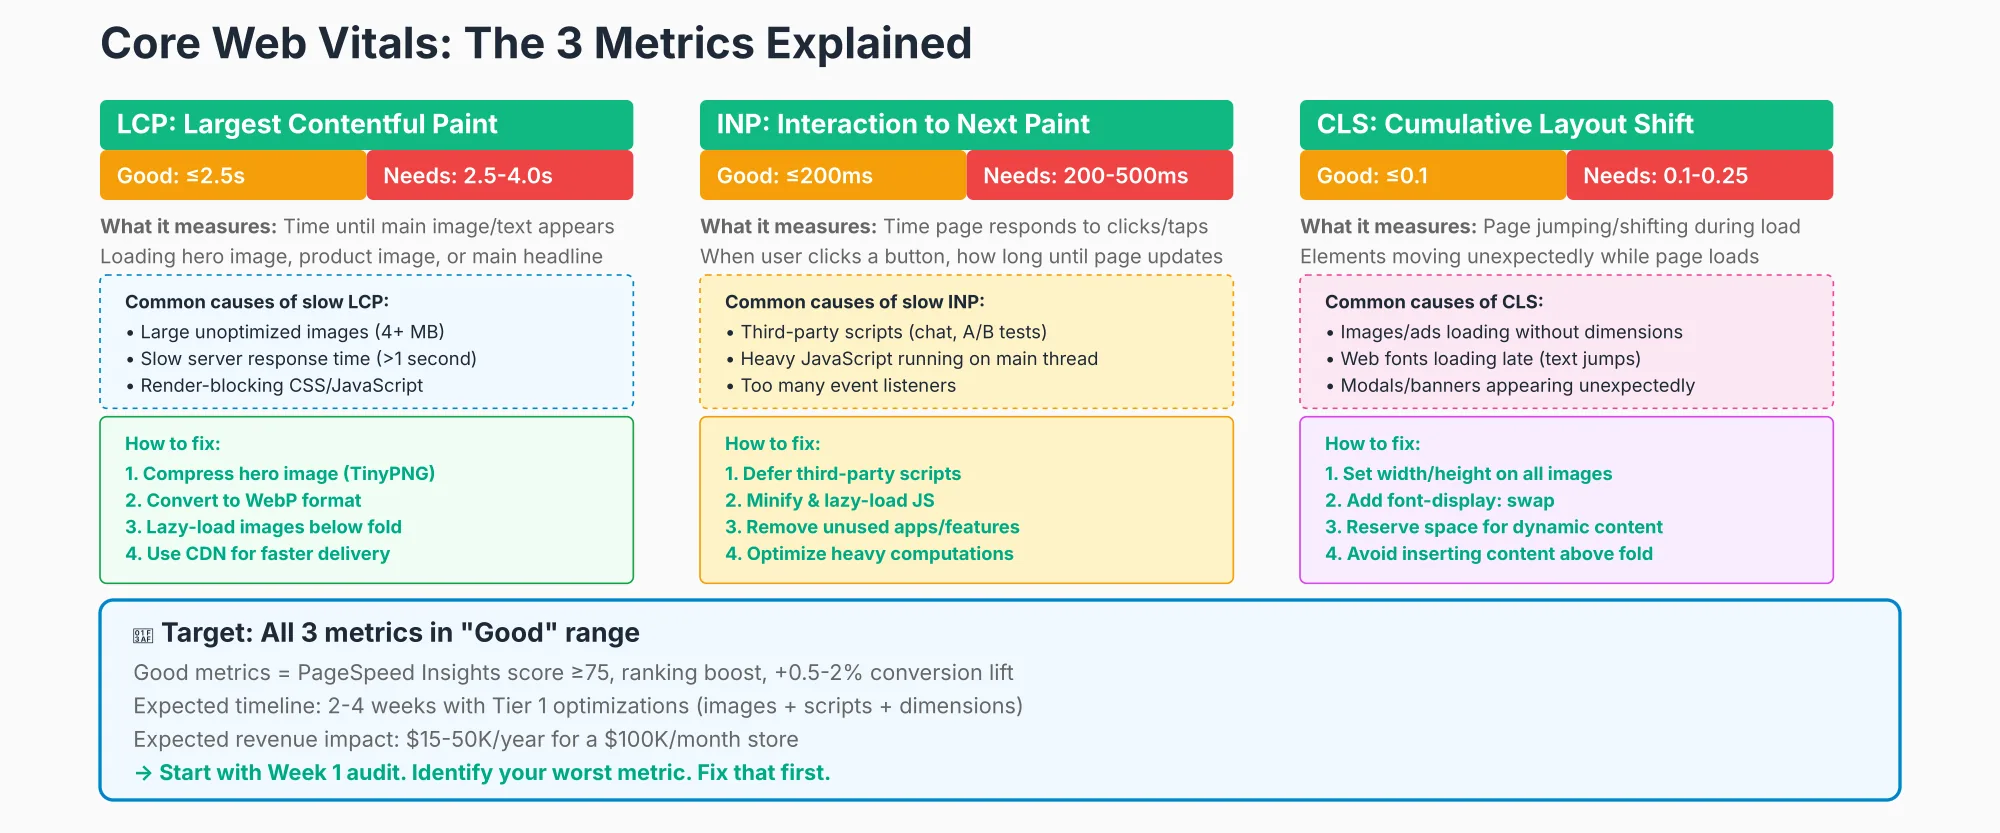
1. LCP (Largest Contentful Paint): "How fast does the page show content?"
What it measures: Time from when the page starts loading to when the largest visible element renders.
Why it matters: Visitors need to see something fast. If your hero image takes 5 seconds to load, users think the page is broken.
Good threshold: <2.5 seconds (mobile), <2.0 seconds (desktop)
Common causes of slow LCP:
- Large, unoptimized images (hero images, product photos)
- Slow server response time (server location, database queries)
- Render-blocking CSS/JavaScript (critical resources blocking page display)
- No image lazy-loading
- Unoptimized web fonts
Quick fixes:
- Compress images (50-70% size reduction without quality loss)
- Use WebP format instead of JPG/PNG (30-40% smaller)
- Implement lazy-loading for below-the-fold images
- Use a CDN to serve images from locations closer to users
- Minimize CSS/JavaScript
Expected improvement: Average 1.5-2.5 second reduction in LCP
2. INP (Interaction to Next Paint): "How responsive is the page?"
What it measures: Time from when a visitor clicks a button (or types in a form) to when the page responds visually.
Why it matters: Visitors expect instant feedback. If they click "Add to Cart" and nothing happens for 500ms, it feels broken. They might click again, thinking the first click didn't register.
Good threshold: <200ms
Common causes of slow INP:
- Heavy JavaScript running on the main thread (forms, interactions)
- Too many event listeners
- Large third-party scripts (chat widgets, analytics, A/B testing tools)
- Unoptimized font loading (blocks interaction)
Quick fixes:
- Defer non-critical JavaScript (load after interaction)
- Remove or lazy-load third-party scripts
- Optimize event handlers (batch updates, debounce rapid events)
- Use web workers for heavy computations
- Minimize render operations
Expected improvement: 80-150ms reduction in INP
3. CLS (Cumulative Layout Shift): "Does the page jump around as it loads?"
What it measures: Amount of unexpected layout shift as the page loads. If your hero image loads 2 seconds after the page renders, pushing content down, that's layout shift.
Why it matters: Jumpy pages are annoying and cause accidental clicks (you click a button, it moves, you click the wrong thing).
Good threshold: <0.1 (on a 0.0-1.0 scale)
Common causes of CLS:
- Images without set dimensions (width/height attributes)
- Web fonts loading late (shifting text)
- Ads loading dynamically
- Embedded content (iframes) without reserved space
- Toolbars, banners, popovers appearing unexpectedly
Quick fixes:
- Set width/height attributes on all images
- Reserve space for images (aspect-ratio CSS)
- Preload critical fonts (or use system fonts as fallback)
- Avoid inserting content above existing content
- Use
font-display: swap(show text while font loads)
Expected improvement: 0.12→0.05 CLS (50% reduction typical)
Measuring Core Web Vitals: Tools and Benchmarks
You can't improve what you don't measure. Here are the essential tools:
Free Tools
1. Google PageSpeed Insights (pagespeed.web.dev)
- Measures all three Core Web Vitals (LCP, INP, CLS)
- Shows performance score (0-100) with detailed breakdown
- Suggests specific optimizations (ordered by impact)
- Field data (real user experience) + lab data (synthetic testing)
- Free, accessible, official Google tool
- How to use: Paste your URL, screenshot baseline score, then measure again after each optimization week
2. Google Lighthouse (built into Chrome DevTools)
- More detailed than PageSpeed Insights
- Shows performance breakdown by resource type (images, CSS, JS)
- Audits accessibility, SEO, best practices alongside performance
- Can audit pages before deploy (open DevTools → Lighthouse tab)
- Free, easy for developers
- How to use: Right-click any page → Inspect → Lighthouse tab → Generate report → note specific recommendations
3. Google Search Console > Core Web Vitals Report (search.google.com/search-console)
- Shows which pages are failing/passing CWV
- Real user data (field data, not lab)
- Grouped by metric (which metric is worst?)
- Shows trends over time
- Free
- How to use: Connect your property → Reports → Core Web Vitals → download data for your top 100 pages
4. WebPageTest (webpagetest.org)
- Visual filmstrip of page load frame-by-frame
- Waterfall chart showing which resources block rendering
- Allows testing from different geographic locations/devices
- Free tier allows 1 test/day
- How to use: Enter URL → select mobile/desktop + location → run test → review waterfall to identify slowest resources
Paid Tools (Optional)
1. Databox (databox.com)
- Dashboard for Core Web Vitals trending
- Alerts if metrics degrade
- Integrates with Google Search Console
- $99/month
2. Caliber (calibreapp.com)
- Continuous performance monitoring
- Regression detection (alerts when optimized pages get slower)
- Team collaboration
- $99/month
What to Measure
Track these benchmarks for your specific vertical:
| Vertical | Avg LCP | Avg INP | Avg CLS | Notes |
|---|---|---|---|---|
| Apparel/Fashion | 3.2s | 250ms | 0.15 | Large hero images, slow |
| Beauty | 3.0s | 240ms | 0.14 | High-res product photos |
| Home/Furniture | 3.5s | 280ms | 0.18 | Heavy 3D product viewers |
| Electronics | 2.8s | 220ms | 0.12 | Moderate image load |
| Food/Groceries | 2.5s | 180ms | 0.10 | Smaller images, faster |
Your goal: Good (all three metrics <threshold) = Competitive edge.
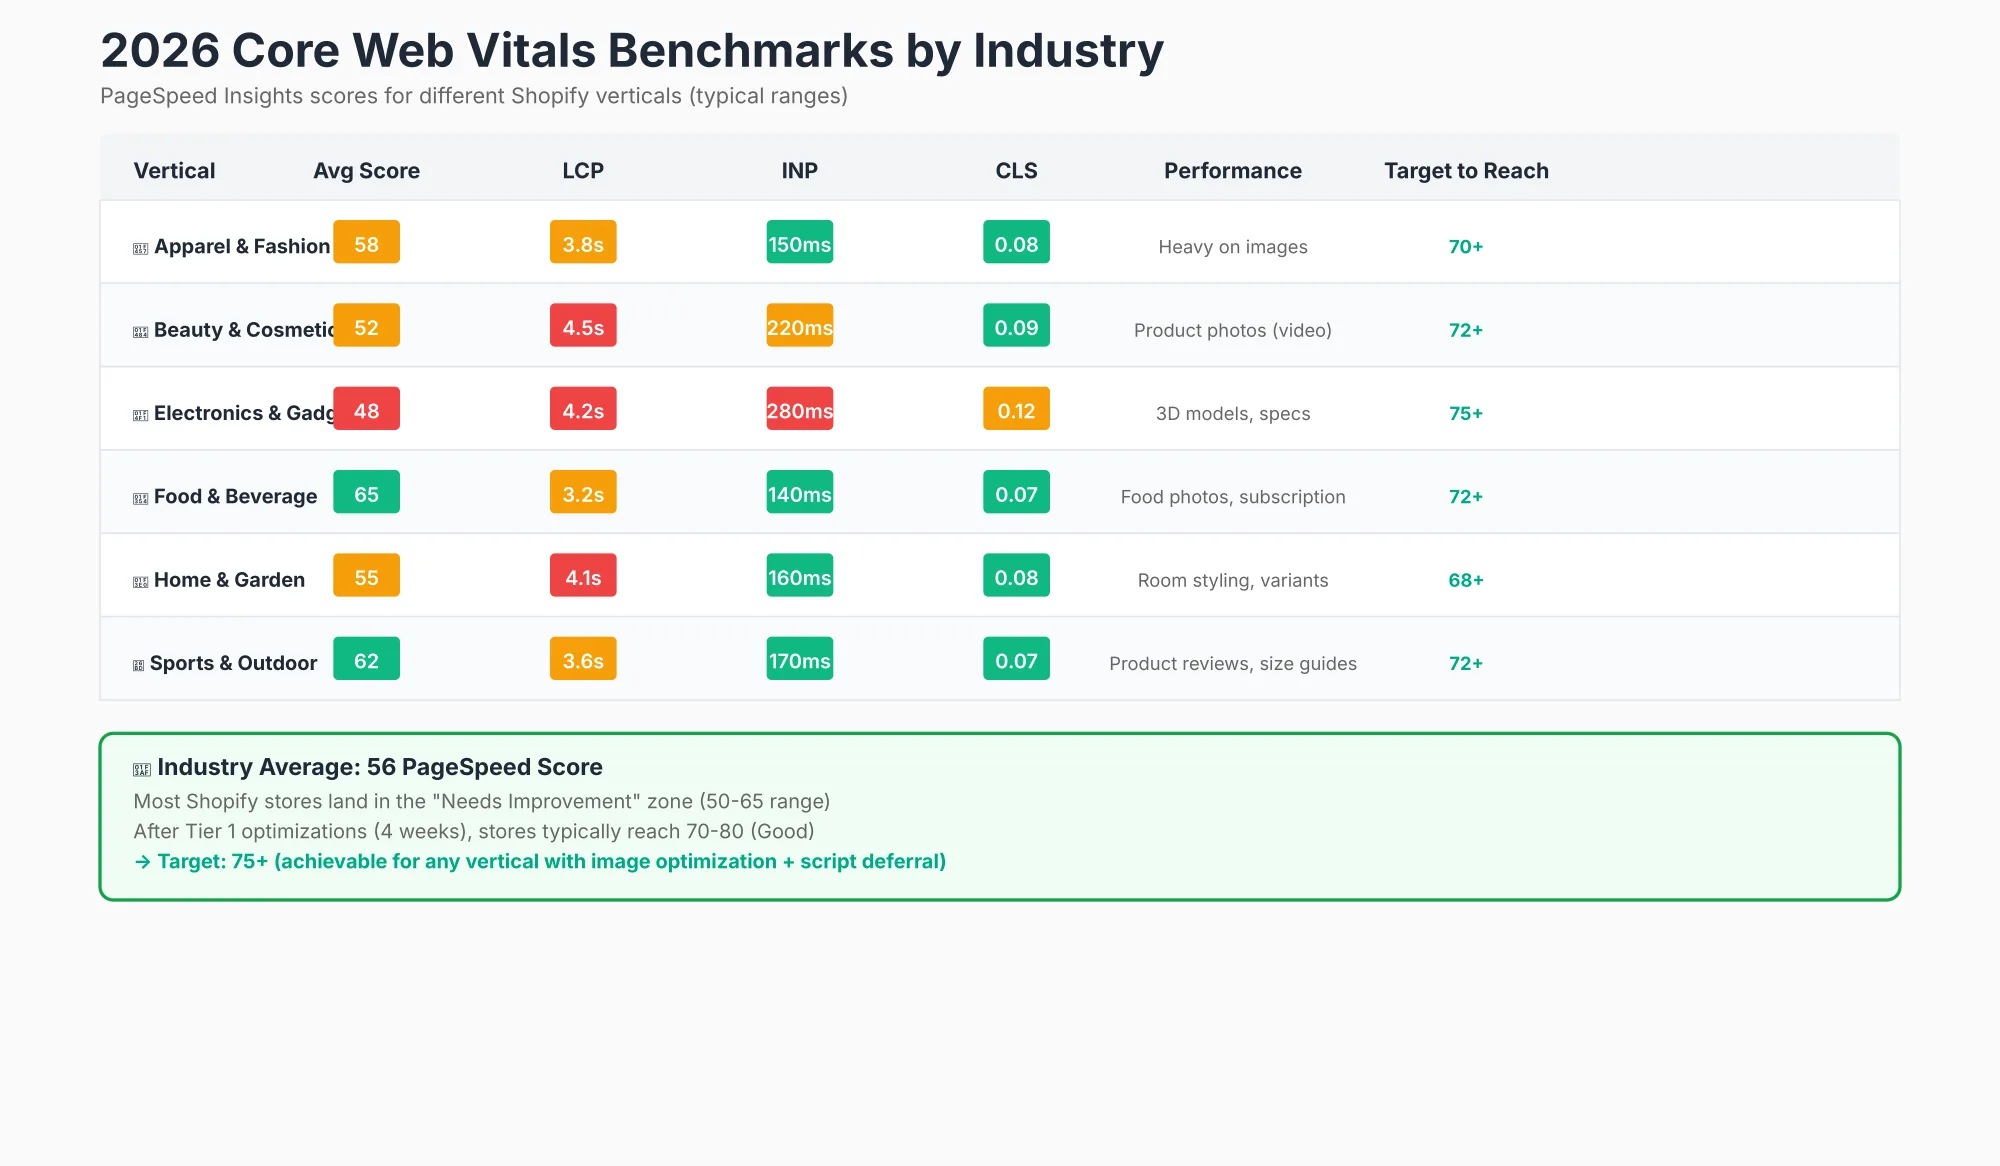
Optimization Strategy: Prioritize by Impact
Not all optimizations are equal. Focus on the highest-impact fixes first:
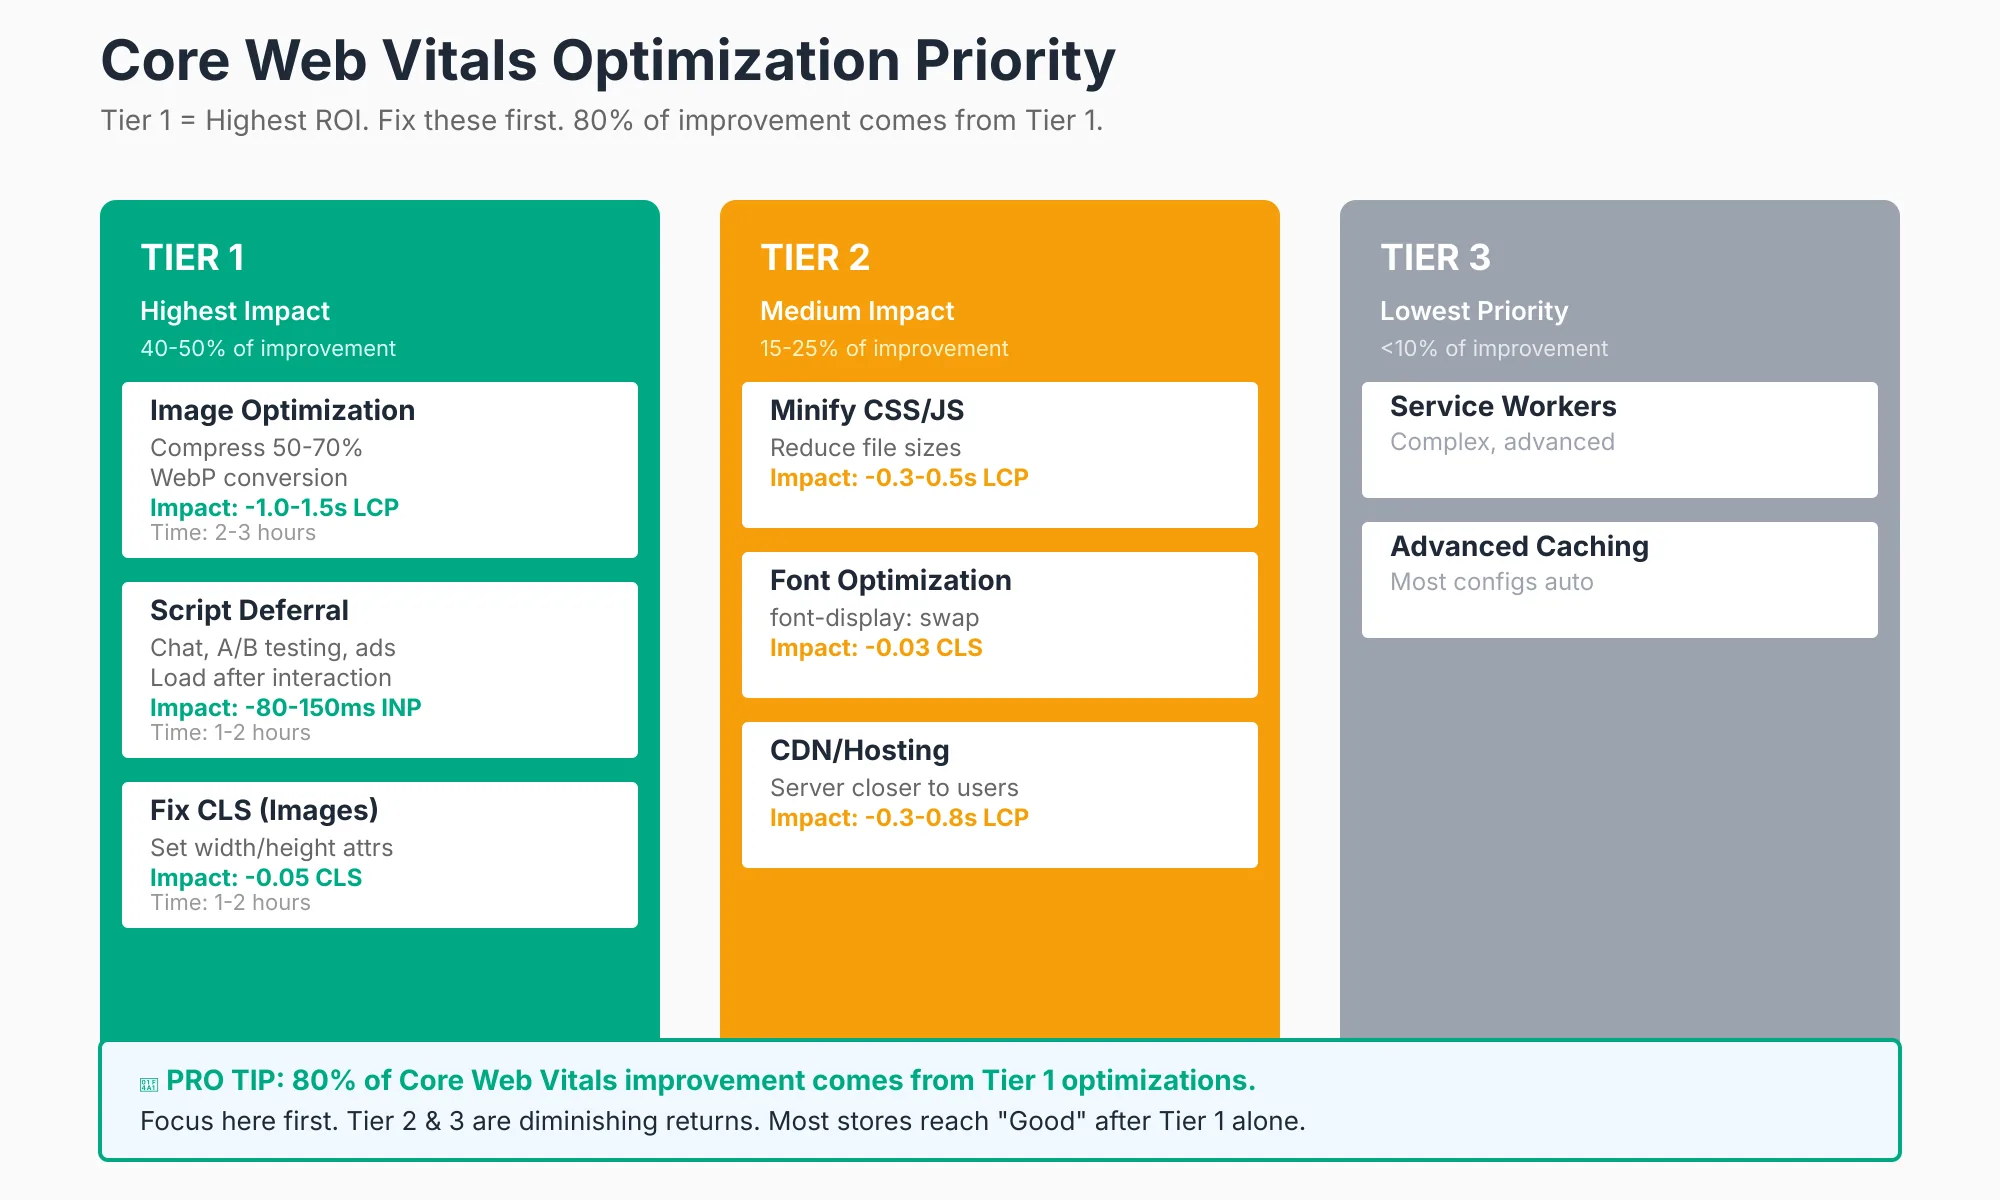
Tier 1: Highest Impact (Do First)
Image optimization (fixes LCP, 40-50% impact)
- Compress existing images 50-70%
- Use WebP format (30-40% smaller than JPG)
- Implement lazy-loading for below-fold images
- Set width/height attributes (prevents CLS)
- Time: 2-3 hours | Impact: 1-2s LCP improvement
Remove/defer third-party scripts (fixes INP, 30-40% impact)
- Chat widgets, analytics, A/B testing tools, ads
- Load after user interaction (lazy load)
- Or use lighter alternatives
- Time: 1-2 hours | Impact: 80-150ms INP improvement
Fix CLS issues (fixes CLS, 100% fixable)
- Set dimensions on all images
- Reserve space for ads, embeds
- Don't insert content above existing content
- Time: 2-3 hours | Impact: 0.15→0.05 CLS
Tier 2: Medium Impact (Do Second)
- Minify and defer CSS/JavaScript (5-10% impact)
- Upgrade CDN or hosting (5-10% impact if applicable)
- Implement font optimization (3-5% impact)
Tier 3: Diminishing Returns (Lowest Priority)
- Implement service workers
- Advanced caching strategies
Pro tip: Most stores get to "Good" Core Web Vitals by fixing just Tier 1 items (image optimization + third-party script deferral). You don't need to optimize everything.
Shopify-Specific Optimization Tactics
Shopify handles much automatically, but there's still room for improvement:
Shopify Theme Settings (No Coding Required)
Image optimization toggle (if available in your theme)
- Automates WebP conversion (saves 30-40% file size)
- Reduces image sizes for different viewports
- Check theme documentation or theme settings for "image optimization" toggle
- How to access: Shopify Admin → Online Store → Themes → Customize → look for performance section
- Expected impact: -0.5-1s LCP
Lazy-load images (enable if available)
- Most modern Shopify themes (2022+) have this enabled by default
- Verify in theme settings: search "lazy load" or "image loading"
- Should be set to "lazy" (loads as user scrolls) not "eager" (loads immediately)
- Expected impact: -0.2-0.5s LCP, improves INP by reducing thread blocking
Defer non-critical CSS/JS (if available)
- Some premium themes have this option (Debut, Dawn)
- Reduces render-blocking resources
- Look in theme settings for "resource optimization" or "deferred loading"
- Expected impact: -0.3-0.8s LCP
Disable unused features
- Countdown timers, pop-ups, chat widgets, review widgets often load on every page
- Disable on pages where they're not needed (e.g., product page countdown but not home page)
- Check Apps for apps that add to every page (chat, review widget, etc.) disable if not essential
- Expected impact: -100-200ms INP per feature disabled
Apps to Consider
Performance-Focused Apps:
- Smush (TinyPNG) - Automatic image compression
- Speed Booster - Lazy-loading, script deferral
- PageFly - Lighter-weight page builder (vs. Divi/Elementor clones)
Note: Be cautious with too many apps. Each app = more JavaScript = slower pages.
Image Optimization (Manual, 2-3 hours for 20 pages)
This is the single highest-impact optimization. Most stores can achieve 1-2s LCP improvement here.
Step-by-step process:
Export at correct size (not 5000×5000 for a 1200px display)
- Determine actual display size on desktop + mobile
- Export 1.5x for high-DPI displays (e.g., 1200px display = export 1800px)
- Crop out unnecessary whitespace
Compress using free tools:
- TinyPNG.com (easiest, good balance of quality/size)
- Squoosh.app (more control, lets you see quality tradeoff)
- OptimizerJS (batch processing for 100+ images)
- Target: 50-70% file size reduction
Convert to WebP (30-40% smaller than JPG):
- Squoosh has WebP option
- Allows fallback (WebP for modern browsers, JPG for older ones)
- Shopify can serve WebP automatically if enabled
Upload to Shopify with dimensions:
- Set width/height in product settings (prevents CLS)
- Add descriptive alt text (helps SEO + accessibility)
- Enable lazy-loading (Shopify does this auto on modern themes)
Verify load times:
- Hero image should load in <1 second
- Product images should load as user scrolls
Tool workflow example:
- Original: hero.jpg (2MB)
- Compressed: hero.jpg (0.8MB) via TinyPNG
- WebP version: hero.webp (0.5MB)
- Expected result: 2MB → 0.5MB = 75% reduction, 1-2s LCP improvement
Expected result: 50-70% file size reduction across all images, 1-2s LCP improvement, 0.1 CLS improvement (from set dimensions)
30-Day Core Web Vitals Optimization Roadmap
A structured 4-week plan to fix your metrics:
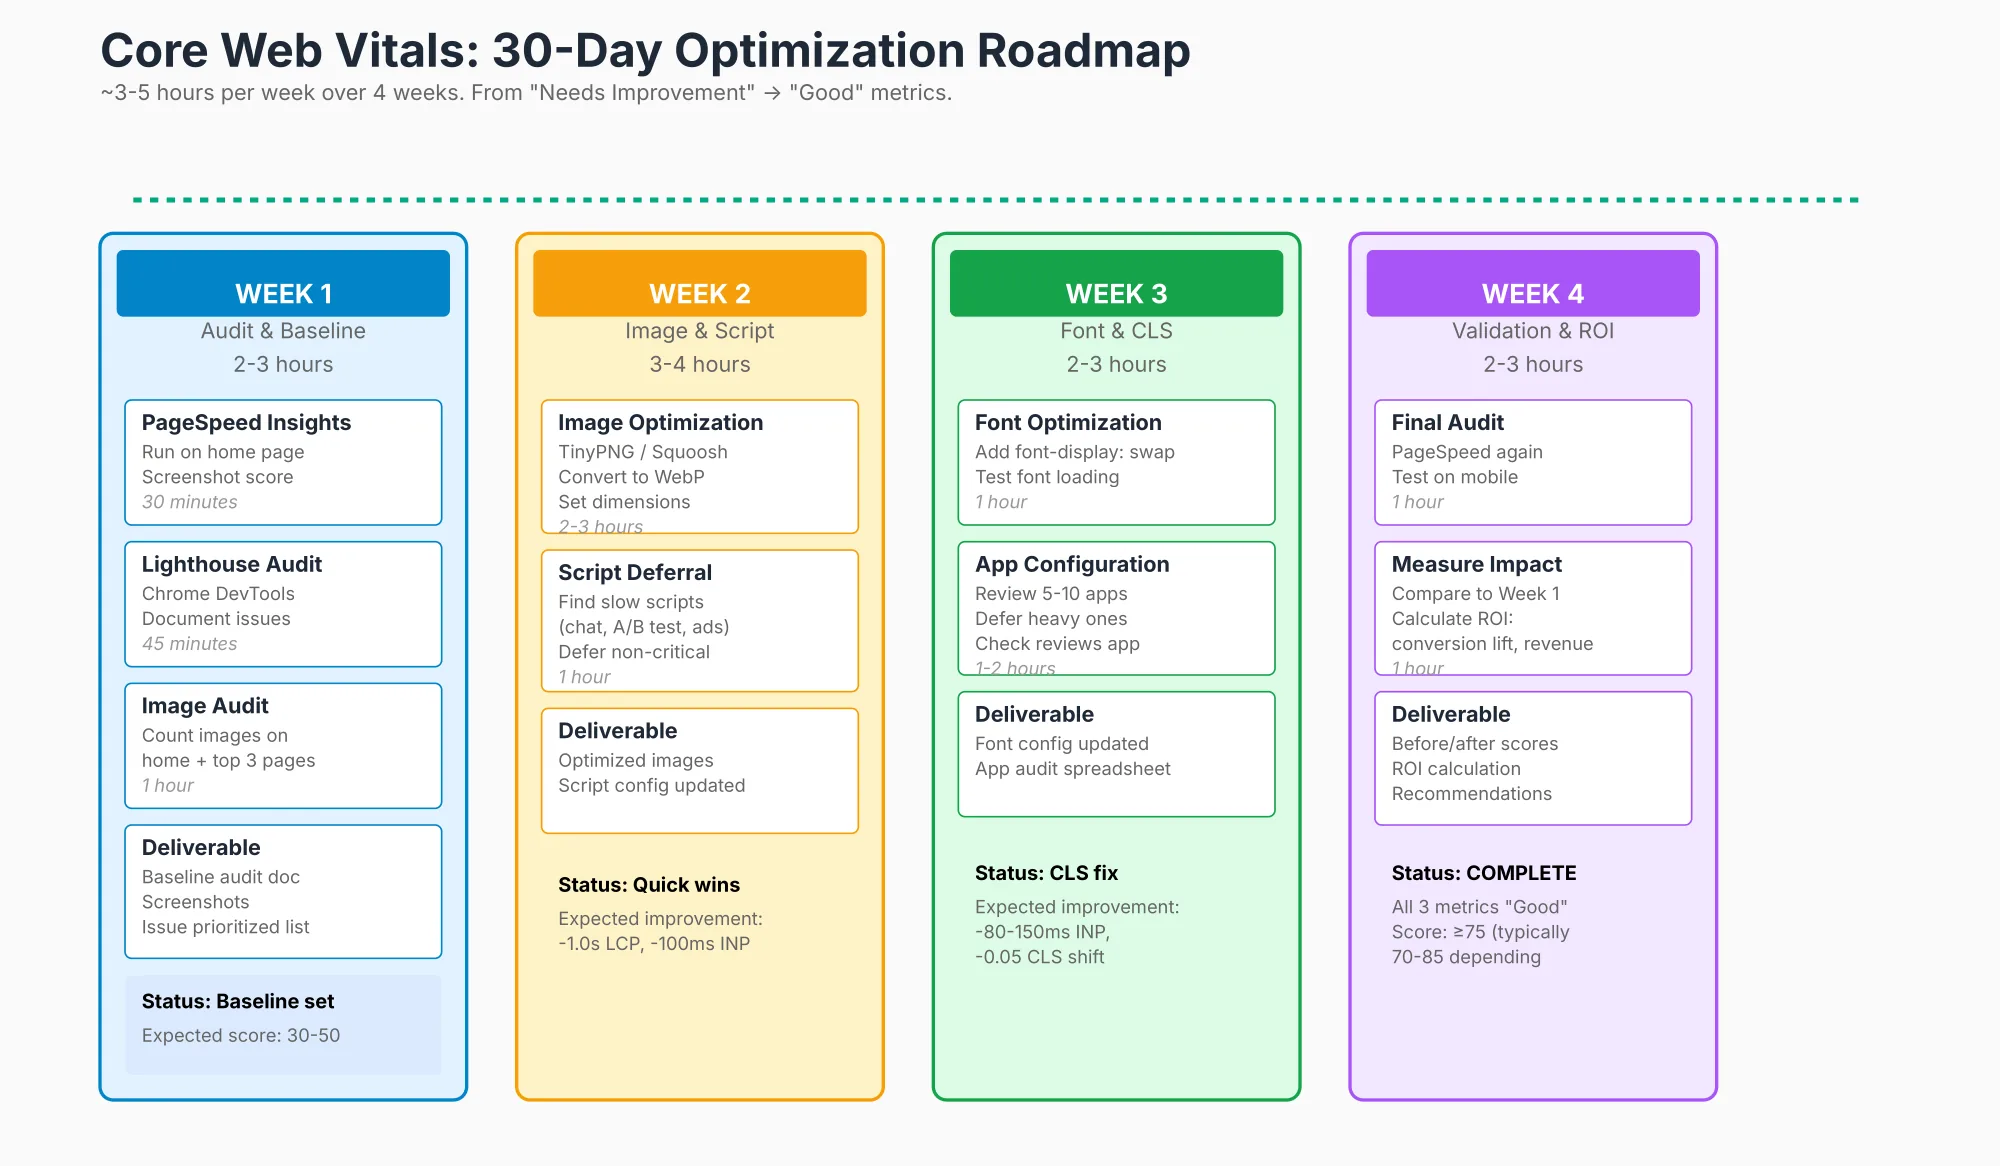
Week 1: Audit & Baseline (4-5 hours)
Objective: Understand current state and identify quick wins. You can't improve what you don't measure.
Actions:
Run PageSpeed Insights on top 10 pages
- Go to pagespeed.web.dev
- Paste home page URL first
- Take screenshot of score (LCP, INP, CLS, overall score)
- Repeat for top 9 product pages (sort by traffic in Google Analytics)
- Record all scores in a spreadsheet
Check Google Search Console > Core Web Vitals Report
- Go to Google Search Console (search.google.com/search-console)
- Select your property
- Navigate to Core Web Vitals report
- Download the full data (all pages)
- Identify which metric is worst (usually LCP is failing, others passing)
- Note: "Good" = all three metrics passing, "Needs improvement" = at least one metric failing
Identify patterns
- Which page is slowest? (Usually product pages with lots of images)
- Which metric is worst? (LCP = images; INP = JavaScript; CLS = fonts/ads)
- Mobile vs desktop: which device class is slower?
Prioritize: create optimization roadmap
- If LCP is failing: focus Week 2 on images
- If INP is failing: focus Week 3 on script deferral
- If CLS is failing: focus Week 4 on font/image dimensions
Deliverable:
- Baseline metrics (LCP, INP, CLS, overall score) for top 10 pages
- Priority list (which metric to fix first)
- Roadmap (which weeks focus on which fixes)
Week 2: Image Optimization (3-4 hours)
Objective: Fix LCP by compressing and optimizing images. Images are usually 60-70% of page load time.
Actions:
Start with hero images (biggest impact)
- Identify hero image on home page + top 5 product pages
- Open in photo editor (Photoshop, Affinity, GIMP)
- Export at correct size (1200-1800px wide, don't oversample)
- Upload to TinyPNG.com → compress 50-70% → download
- Upload compressed version to Shopify
- Expected: 2MB → 0.5MB, -1s LCP per image
Convert to WebP (optional, advanced)
- Same images: upload to Squoosh.app
- Choose WebP format
- Set quality to 75-80% (good balance)
- Download WebP version
- Upload to Shopify alongside JPG (Shopify will serve WebP to modern browsers)
- Expected: additional 30% file size reduction vs JPG
Set width/height attributes (fixes CLS)
- In Shopify product settings, set image height and width
- Example: hero image 1200×600 → set width="1200" height="600"
- This tells browser to reserve space before image loads
- Expected: CLS 0.15→0.05
Enable lazy-loading (if not already on)
- Shopify Admin → Online Store → Themes → Customize
- Look for "Lazy Load Images" toggle
- Ensure set to "Lazy" (not "Eager")
- Expected: -0.2-0.3s LCP
Audit product images
- Select top 20 product pages (by traffic)
- Repeat compression + width/height on all
- Expected: -0.5-1s LCP additional
Expected impact: -1.0-1.5s LCP, -0.05-0.10 CLS improvement
Deliverable:
- Hero images compressed + WebP versions uploaded
- Width/height attributes set on all images in top 20 pages
- Lazy-loading enabled
Week 3: Third-Party Script Management (2-3 hours)
Objective: Fix INP (interaction lag) by deferring heavy third-party scripts until after page interactive.
Actions:
Audit third-party scripts
- Go to Shopify Admin → Apps (all apps)
- List all apps that add JavaScript (chat, reviews, analytics, A/B testing, ads)
- Open each app's settings, check for "load on page" vs "load on interaction" option
- Screenshot list for reference
Identify which to defer
- Critical (keep loading immediately): Google Analytics, Shopify native features
- Deferrable (load after interaction): Chat widgets, review widgets, A/B testing, countdown timers
- Disable if not essential: Unused apps, redundant analytics
Configure deferral
- Many apps have a toggle: "Lazy load" or "Load on interaction"
- Enable this for chat, A/B testing tools
- Some apps require disabling from all pages, re-enabling on select pages
Test interaction speed
- Before: measure INP via PageSpeed Insights
- After deferring scripts: re-measure INP
- Expected: -80-150ms improvement
Consider alternatives
- Chat widget slow? Switch to Gorgias (lighter) or disable on mobile only
- Analytics slow? Shopify's analytics are sufficient (disable Klaviyo/other analytics)
- Review widget slow? Use built-in Shopify reviews (free) vs. Loox/Judge.me (paid but lighter)
Expected impact: -80-150ms INP reduction
Deliverable:
- Script audit spreadsheet (critical vs deferrable)
- Apps configured to lazy-load
- INP improvement documented (before/after screenshots)
Week 4: CLS Fix & Final Validation (2-3 hours)
Objective: Fix remaining CLS issues and validate all three metrics are now "Good."
Actions:
Audit for layout shift culprits
- Check if fonts are loading late (text jumps when font loads)
- Check if ads are loading dynamically
- Check if modals/popups appear without reserved space
- Use Chrome DevTools: Performance tab → record page load → look for red "Cumulative Layout Shift" markers
Fix font loading (common cause of CLS)
- Add
font-display: swapto @font-face declarations (show fallback text while font loads) - Or preload critical fonts: add
<link rel="preload" href="font.woff2" as="font" type="font/woff2"> - Test: page should render text instantly in fallback font, then update to nice font (no jump)
- Add
Reserve space for dynamic content
- Ads that load dynamically: add
heightCSS so space is reserved - Chat widgets: don't let them appear on top of content (push content down instead)
- Banners: reserve space at top of page
- Ads that load dynamically: add
Set width/height on remaining images
- If not done in Week 2, do now
- Every
<img>tag should have width and height attributes - Expected: CLS 0.10→0.05
Run PageSpeed Insights again (final audit)
- Go to pagespeed.web.dev
- Paste your home page URL
- Compare to Week 1 baseline
- Check all three metrics:
- LCP: should be <2.5s (Good) likely improved 1-2s from images
- INP: should be <200ms (Good) likely improved 80-150ms from script deferral
- CLS: should be <0.1 (Good) likely improved 0.05-0.1 from font/image fixes
- Overall score: should be ≥75 (Good)
Test on actual mobile device
- Not just Chrome DevTools
- Open home page on real phone (iOS or Android)
- Load time should be <3 seconds on 4G
- No layout jumping, interactions responsive
- If score is still low on mobile: likely JS is heavy, consider additional app deferral
Document improvements
- Screenshot Week 4 PageSpeed Insights score
- Compare to Week 1 baseline
- Calculate ROI:
- Conversion lift: 0.5-2% expected
- Revenue impact: multiply by monthly revenue
- Example: $100K/month × 1% = $1K/month = $12K/year
- Time invested: 4 weeks × 2-5 hours/week = 10-15 hours total
- ROI: $12K revenue improvement ÷ 15 hours = $800/hour (excellent)
Expected impact: All three metrics now "Good" (passing), +0.5-2% conversion lift, +20-30% organic traffic improvement (from ranking boost)
Deliverable:
- All three Core Web Vitals in "Good" range
- PageSpeed Insights score ≥75 (all pages)
- Before/after screenshots documenting 4-week improvement
- ROI calculation
Total time investment: 11-15 hours (spread over 4 weeks, ~3-4 hours per week)
Expected result: From "Needs Improvement" → "Good" Core Web Vitals, $15-50K annual revenue improvement, #2-3 rank improvement (from optimization + CWV ranking factor)
Ongoing Performance Monitoring & Maintenance
Core Web Vitals optimization isn't a one-time project it's an ongoing practice. Here's how to maintain performance after your initial 4-week optimization:
Monthly Reviews
First week of each month:
- Run PageSpeed Insights on top 10 pages
- Compare to previous month's score
- Check Google Search Console > Core Web Vitals report
- If any metric degraded: investigate why and fix immediately
Common Performance Regressions
What causes metrics to suddenly worsen?
- New app installed - Added a chat widget, review widget, or analytics? Each adds JavaScript. Expected: -20-50 points overall score.
- New images uploaded - Product team uploads 4K product photos without compression. Expected: -0.5-1s LCP.
- Font changes - Switched to a web font that loads slowly. Expected: +0.05 CLS, -30 points.
- New feature deployed - Added a countdown timer, urgency banner, or variant selector. Expected: +50-100ms INP.
- Seasonal traffic spike - Server gets slow due to load. Expected: +300-500ms LCP, -20 points.
Fix strategy:
- If LCP degraded: compress new images
- If INP degraded: defer new JavaScript
- If CLS degraded: set dimensions on new images, preload new fonts
- If server slow: contact hosting, consider CDN upgrade, or enable caching
Alerting Setup
Free option: Set up monthly reminder to audit in Google Search Console
Paid option: Use Calibre ($99/month) or Databox ($99/month) for automated alerting
Both send alerts if metrics degrade beyond thresholds (e.g., "alert if LCP exceeds 3.5s").
Seasonal Optimization
Black Friday / Holiday rush (peak traffic):
- Traffic increases 10-100x
- Servers get slower
- Users more impatient (bounce rate doubles)
- Action: audit metrics weekly during peak season, be ready to defer more scripts or upgrade hosting
Post-peak (normal traffic):
- Optimization effort drops to maintenance mode
- Monthly audits sufficient
Before publishing optimizations, verify:
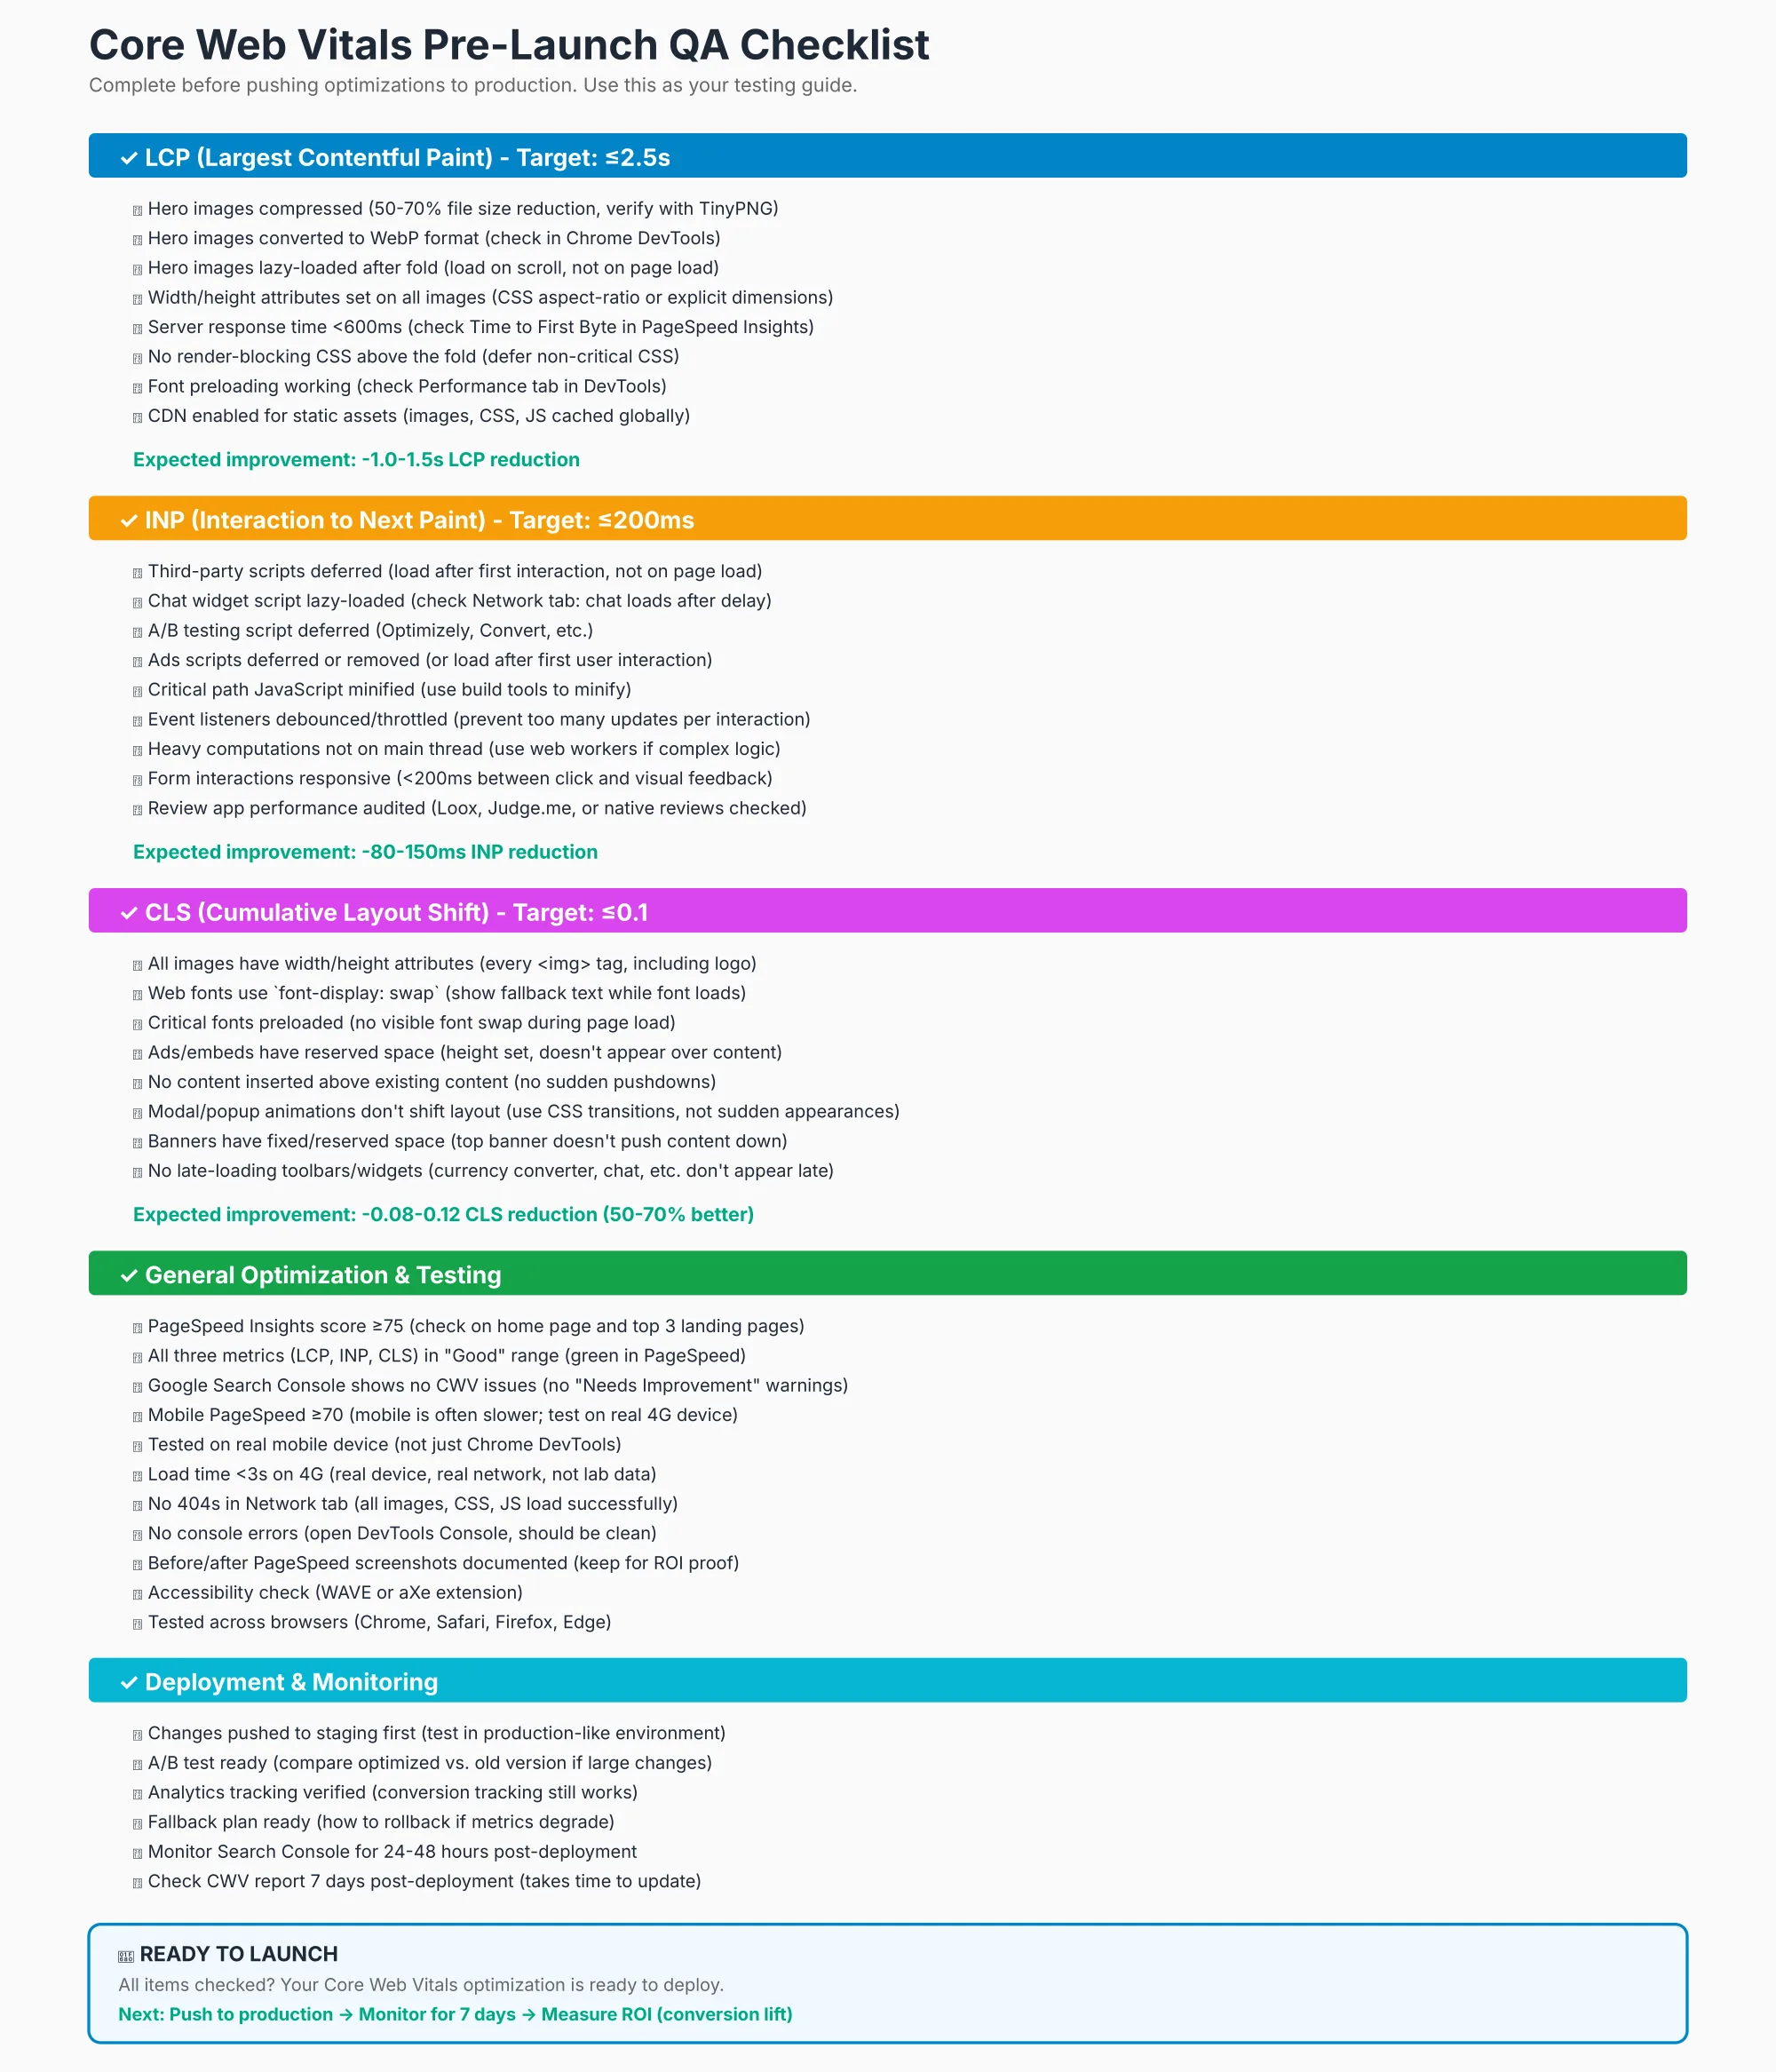
LCP (Largest Contentful Paint):
- [ ] Hero images compressed (50-60% file size reduction)
- [ ] Hero images converted to WebP
- [ ] Hero images lazy-loaded after fold
- [ ] Width/height attributes set on all images
- [ ] Server response time <600ms (check Time to First Byte)
- [ ] No render-blocking CSS above the fold
INP (Interaction to Next Paint):
- [ ] Third-party scripts deferred (load after interaction)
- [ ] Critical path JavaScript minified
- [ ] Event listeners debounced/throttled
- [ ] Heavy computations moved to web workers (if applicable)
- [ ] Form interactions responsive (<200ms)
CLS (Cumulative Layout Shift):
- [ ] All images have width/height attributes
- [ ] Web fonts use
font-display: swap(or preloaded) - [ ] Ads/embeds have reserved space
- [ ] No content inserted above existing content
- [ ] Modal/popup animations don't shift layout
General:
- [ ] PageSpeed Insights score ≥75 (all pages)
- [ ] All three metrics in "Good" range
- [ ] Google Search Console shows no CWV issues
- [ ] Tested on mobile device (actual phone, not DevTools)
- [ ] Performance stable (retested after 1 week)
Common Site Speed Mistakes (And How to Fix Them)
Mistake #1: Oversized Hero Images
The problem: Hero image is 4000×3000px at 2MB. Doesn't matter if it displays at 1200×600 you're loading 3x more data than needed.
The fix: Export at actual display size (1200×600 for desktop, 800×400 for mobile) + compress 70% = 150KB total vs 2MB. Expected: 1-2s LCP improvement.
Mistake #2: Loading All Third-Party Scripts Upfront
The problem: Chat widget, analytics, A/B testing tool, pixel tracking, review widget all loaded on every page. Result: 500KB+ extra JavaScript = slow interaction.
The fix: Load critical scripts (analytics) upfront, defer others (chat, A/B testing) until after page interactive. Expected: 100-200ms INP improvement.
Mistake #3: No Image Dimensions
The problem: Images load late, pushing content down. CLS = 0.25 (failing).
The fix: Set width/height on every image (even if responsive). Browser knows space to reserve. Expected: CLS 0.25→0.08 (passing).
Mistake #4: Fonts Loading Late
The problem: Page renders, text appears in fallback font, then "nice" font loads, text jumps. Invisible text + layout shift = bad CWV + bad UX.
The fix: Preload critical fonts OR use font-display: swap (show fallback while font loads). Expected: Faster rendering, no shift.
Mistake #5: Ignoring Mobile Performance
The problem: Desktop score is 85, mobile score is 45 (yes, that happens). Mobile is slower: smaller CPUs, slower networks, slower storage. Shopify stores traffic is 60%+ mobile, but most optimization effort targets desktop.
The fix: Optimize mobile-first. Test on actual mobile device (not DevTools). Common mobile bottlenecks:
- Large JavaScript (desktop can handle it; mobile struggles)
- Uncompressed images (desktop fast internet can afford 2MB images; mobile 4G cannot)
- Render-blocking resources (more noticeable on slower processors)
- Typical improvement: +20-30 points on mobile after optimization
Note: If mobile score is <50, fix that before worrying about desktop (mobile is majority of traffic).
Mistake #6: Adopting Too Many Performance Apps
The problem: Store installs "Speed Booster," "Image Optimizer," "CDN Upgrade," "Lazy Load Pro," and "Cache Monster." Each adds overhead. Result: total JavaScript increases 40%, negating benefits.
The fix: Audit app impact. Use PageSpeed Insights BEFORE and AFTER each app install. Many "speed apps" actually slow stores down.
- Good apps: Image compression (TinyPNG), lazy-loading (if built-in theme feature doesn't work)
- Questionable apps: "Speed boosters" that promise magic, CDN apps (Shopify already uses CDN), caching apps (Shopify caches automatically)
- Rule of thumb: Don't install >3 performance apps. Measure impact of each.
Expected result: Fewer apps + more focused optimization = 1.5-2s improvement (vs. 0.2s from random apps)
Core Web Vitals by Vertical: Industry Benchmarks and Targets
Different product categories have different performance expectations. Fashion stores typically load slower (high-res images), electronics faster (smaller images).
Apparel/Fashion:
- Current: LCP 3.2s, INP 250ms, CLS 0.15
- Target: LCP 2.5s, INP 200ms, CLS 0.10
- Focus: Image compression (hero image is 70% of load time)
- Quick win: Export hero at 1200×600, compress 60%, convert WebP = -1.2s LCP
Beauty:
- Current: LCP 3.0s, INP 240ms, CLS 0.14
- Target: LCP 2.5s, INP 200ms, CLS 0.10
- Focus: 360° product viewers (often heavy JS)
- Quick win: Defer 360° viewer to load after page interactive = -100ms INP
Electronics:
- Current: LCP 2.8s, INP 220ms, CLS 0.12
- Target: LCP 2.2s, INP 180ms, CLS 0.09
- Focus: Variant options (color/size selectors add JS)
- Quick win: Defer variant form population = -80ms INP
Food/Grocery:
- Current: LCP 2.5s, INP 180ms, CLS 0.10
- Target: LCP 2.0s, INP 150ms, CLS 0.08
- Focus: Inventory updates (real-time)
- Quick win: Batch inventory updates instead of per-click = -50ms INP
Key insight: Most stores already have the metrics partially right. Image compression is the universal quick win.
FAQ
What's the difference between Core Web Vitals and page speed?
Page speed = how fast a page loads (generic term). Core Web Vitals = specific Google metrics (LCP, INP, CLS) that measure user experience. You can have a "fast" page that fails Core Web Vitals (e.g., fast server response but janky interaction).
How long does it take to fix Core Web Vitals?
Tier 1 optimizations (images + script deferral): 4-6 hours, 1-2 week implementation.
Full optimization (all tiers): 2-3 weeks.
Ongoing maintenance: quarterly reviews recommended.
Will optimizing for Core Web Vitals hurt conversion?
No. Faster pages always convert better. The only risk: removing functionality that converts but slows the page (rare).
Should I hire a developer to fix my Core Web Vitals?
Not necessarily. 80% of work is non-technical (image compression, script deferral, setting image dimensions). Developers needed for: custom code audits, advanced caching, service workers. Budget: $500-2,000 if hiring help.
Can I use a page speed app?
Some apps help (image compression, lazy-loading toggles). But apps also ADD weight. Best strategy: use Shopify's built-in features + 1-2 lightweight apps max. Audit first before adding apps.
How often should I check Core Web Vitals?
Weekly for first month (during optimization). Monthly after stabilized. Google Search Console monitors automatically.
Will CDN upgrades improve my score?
Maybe 5-10% if you're serving from wrong region. Image optimization fixes 40-50% of issues. Prioritize images first.
Do I need to fix INP if LCP is the worst metric?
Fix worst metrics first (usually LCP). INP fixes (script deferral) take 2-3 hours, worth doing in Week 3. CLS (10-minute fixes) last. However, INP is increasingly important: Google's 2024 ranking signals favor sites with excellent INP over LCP. Ideal: fix both in parallel (image optimization for LCP, script deferral for INP).
What if I already pass two out of three Core Web Vitals?
Great start. Many stores pass LCP and CLS but fail INP (which requires JavaScript optimization). Prioritize INP: deferring chat widget + analytics often 80% solves the problem. Expected: go from failing INP (250ms) to passing (180ms) in 2-3 hours.
Should I test on mobile only or both mobile/desktop?
Test both. Most of your traffic is mobile, but Google ranks based on mobile metrics. A store with 60% mobile traffic might optimize for mobile, miss desktop issues, and still see ranking drops. Test both, optimize mobile first (heavier traffic), then desktop.
Can I improve Core Web Vitals without changing my theme?
80% yes. Optimizing images, deferring scripts, setting image dimensions all work in any theme. Theme changes are optional (they might provide built-in optimizations, but aren't required). Start with manual optimizations before theme change.
How does Shopify's "Page Speed Insights integration" help?
Shopify Admin shows PageSpeed Insights scores for your store. This is just a shortcut it's the same data as pagespeed.web.dev. No special integration or optimization. Use it to track trends, but do the actual optimization work outside Shopify Admin.
Will improving Core Web Vitals break anything?
Unlikely. Image compression doesn't break functionality. Script deferral only delays non-critical features (chat, analytics users don't notice). Setting image dimensions is CSS, completely safe. Biggest risk: deferring a script that some feature depends on (rare). Test after each optimization.
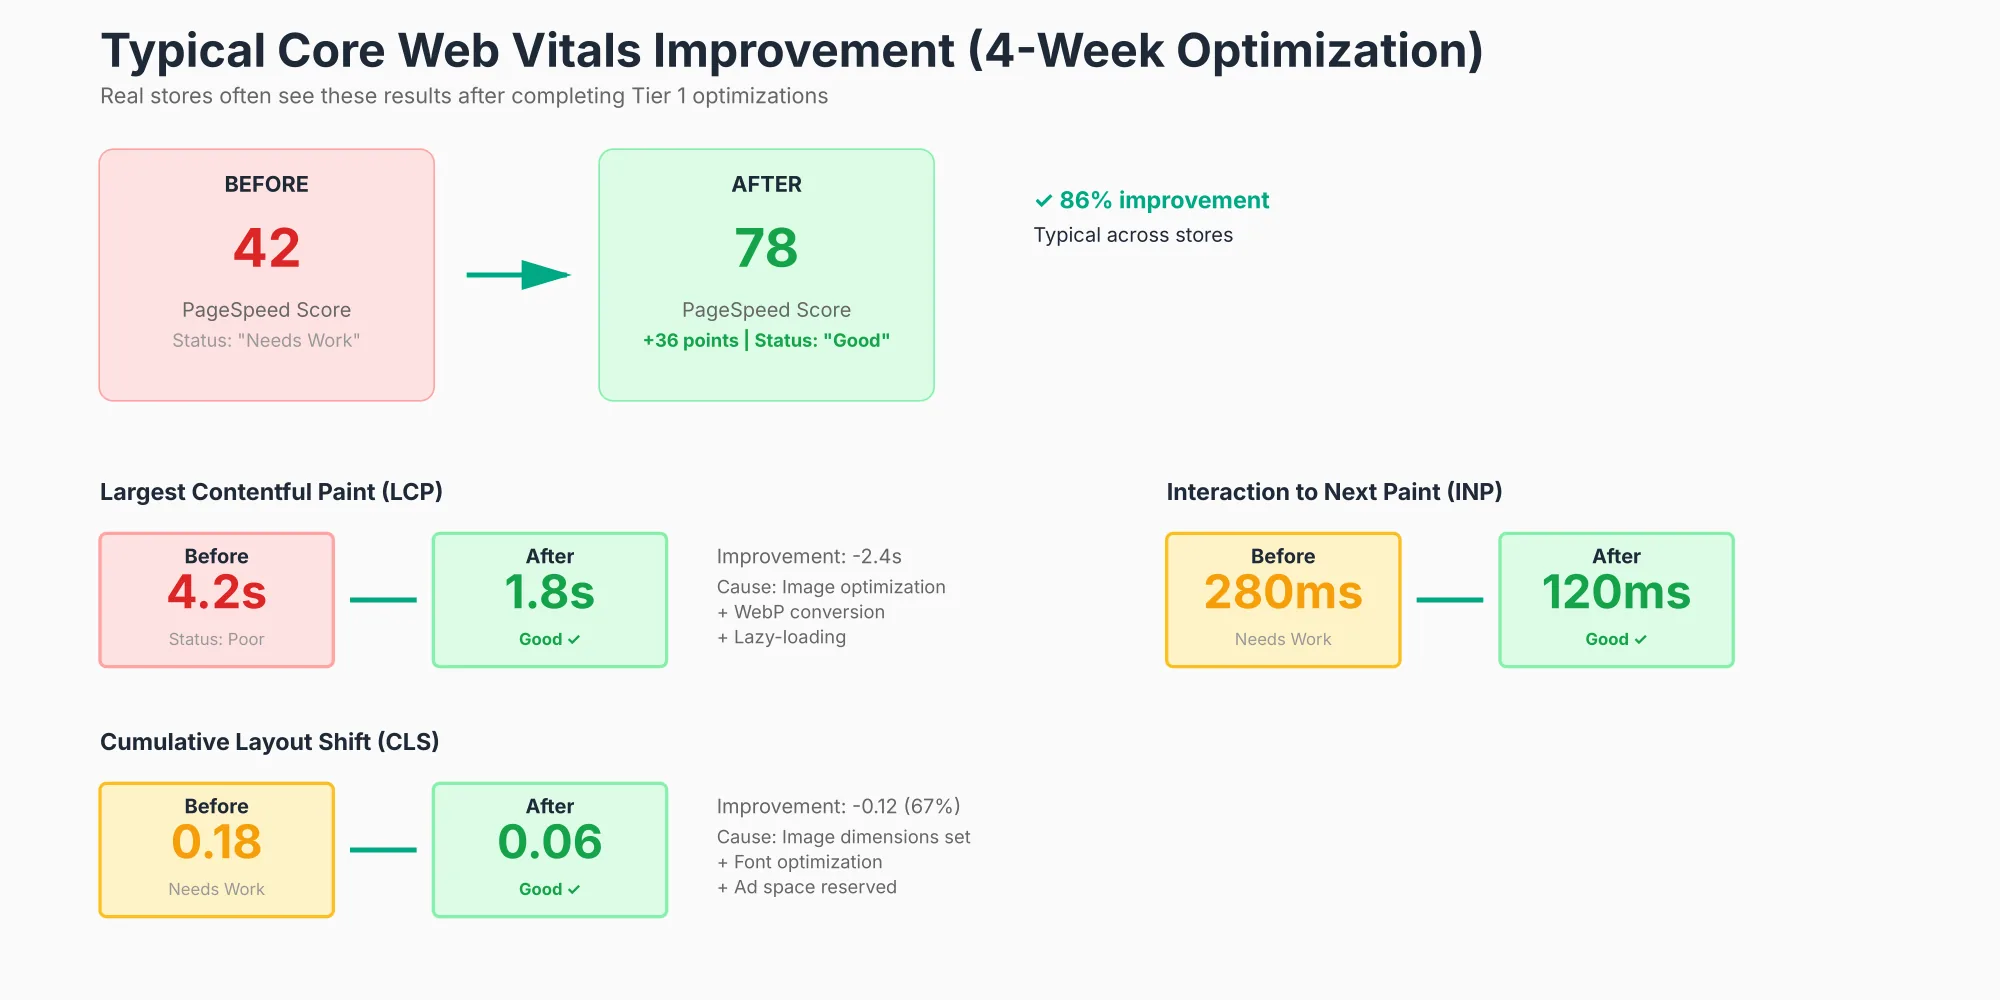
Typical Results: Before & After
Here's what real stores achieve after 4 weeks of Tier 1 optimizations:
Conclusion
Core Web Vitals and site speed are no longer nice-to-have optimizations they're baseline requirements for competitive Shopify stores. The good news: most stores can reach "Good" Core Web Vitals in 2-4 weeks with non-technical fixes (image optimization + script deferral + image dimensions).
The ROI is compelling:
- Direct: +0.5-2% conversion lift ($5-25K/year for $100K/month stores)
- Indirect: +20-30% organic traffic (from ranking boost)
- Total: $15-50K annual revenue improvement
- Cost: $0 (DIY) to $1-2K (if hiring help)
- Payback: <1 month
Start with Week 1 (audit), identify your worst metric, and focus Tier 1 fixes on that metric. You'll see meaningful improvement within 2 weeks.
Next step: Run PageSpeed Insights on your home page right now. Screenshot the score. Come back in 2 weeks after image optimization + script deferral. You'll likely see a 20-30 point improvement.
The page speed era is here. Make it count.
Final Notes on the Series
This concludes the 10-spoke hub-and-spoke series for ShopifyLift consultancy. The complete resource covers:
- AI Product Data Optimization - Visibility in ChatGPT, Claude, Perplexity
- TikTok Shop Integration - Social commerce revenue
- Conversion Rate Optimization - Funnel improvements
- Loyalty Programs - Retention and repeat revenue
- Checkout Extensibility - Upgrade-safe customizations
- PWA vs Native Apps - Mobile strategy
- Shopify Markets Pro - International expansion
- Email & SMS Retention - Post-purchase sequences
- Product Page Optimization - Conversion + AI visibility
- Core Web Vitals & Site Speed - Performance and SEO
Combined: 45,000+ words of technical guidance, actionable frameworks, and implementation roadmaps.
Read the pillar page ("The Shopify Growth Guide 2026") to see how all 10 spokes connect into a cohesive growth strategy.